The Hidden Wattage of Code: Why UK Engineering Teams Are Building a Carbon Ledger for Software
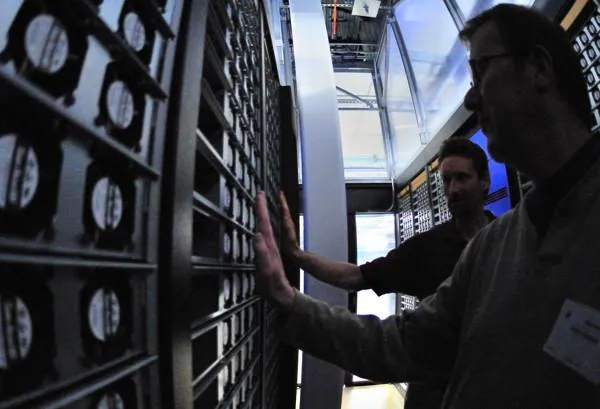
Photo: Intel Free Press, CC BY 2.0, via Wikimedia Commons
Ask a UK engineering director how much electricity a plant consumed last quarter and a figure arrives within minutes, drawn from half-hourly meter data. Ask the same person what the control software, the telemetry pipeline and the cloud analytics layer cost in carbon, and the conversation stalls. The first quantity has an owner, a meter and a line in the annual report. The second has none of these.
That asymmetry is beginning to carry a price. As reporting duties multiply and procurement questionnaires lengthen, the energy footprint of software — the carbon budget of code — is migrating from a curiosity for sustainability teams to a constraint that engineers are expected to design against.
Why software slipped outside the ledger
Facilities carbon is measurable because it is metered at the boundary of a site. Software refuses that treatment. It runs in colocated halls, in cloud regions selected by a platform team, on edge devices bolted to machinery, and inside embedded controllers that may remain in service for fifteen years. The footprint is diffuse, shared between tenants, and frequently owned by a supplier rather than the organisation that depends on it.
For much of the past decade that gap was defensible. Data centres absorb a low single-digit share of UK electricity demand, and few boards pressed the point. Two developments have since changed the calculus. The electricity system has become more variable in carbon terms — the National Energy System Operator publishes half-hourly intensity forecasts, and the difference between a gusty Sunday night and a still weekday evening is wide enough to reshape when deferrable work should run. Meanwhile, the reporting expectations placed on large organisations have hardened rather than loosened.
The anatomy of a defensible software carbon figure
The most useful discipline in circulation is the Software Carbon Intensity specification, standardised as ISO/IEC 21031. It asks for a rate rather than a total: energy consumed, multiplied by the carbon intensity of that energy, plus embodied emissions from the hardware, divided by a functional unit — a request served, a batch completed, a device-month in the field. The rate framing is deliberate. It resists the comfortable assumption that growth in traffic must mean growth in emissions.
Three inputs demand care. Energy is the awkward one, because few software teams control a meter. Host-level power counters, hypervisor estimation, provider dashboards and open-source agents each offer a partial view, with accuracy that varies by workload shape. Intensity is the second: average grid intensity is easy to obtain and marginal intensity is what actually moves when a job is added or removed, and the two diverge sharply on a renewables-heavy system. Embodied emissions are the third, and the least mature — silicon fabrication carries a substantial upfront carbon cost that must be amortised across a plausible service life, and supplier disclosure remains patchy.
For data pipelines, attribution is the practical hurdle. Costs can be tagged to a job, a tenant or a model training run only if the platform has been instrumented to do so; retrofitting that visibility into a legacy estate is slow work. Embedded engineering has a different toolkit and, in some respects, a sharper one. Power profiling on the target board, analysis of sleep states and clock gating, duty-cycled radio links and static inspection of firmware loops can all be evaluated before a device ships — and for battery-powered or energy-harvesting instruments, energy is already a first-class design variable.
From visibility to constraint
The organisations making progress have stopped treating measurement as a reporting chore and started treating it as an engineering input. In practice that means a carbon budget attached to a service, reviewed alongside latency and cost; automated checks in the build pipeline that flag a regression in energy per transaction; and architecture decisions informed by carbon as well as pounds — region selection, time-shifting of deferrable workloads, caching strategy, data retention policy, model size.
It also means joining the conversation with finance. Cloud cost optimisation and carbon optimisation overlap heavily, and the tagging discipline built for one is usually reusable for the other. The caveat is rebound: efficiency gains that reduce the cost of computation tend to increase the volume of computation, so a rate-based metric needs to be read alongside absolute consumption.
The reporting pressure behind the request
The commercial logic is not abstract. Streamlined Energy and Carbon Reporting obliges large UK companies to disclose energy use and emissions, with quoted companies reporting on a global basis. Where cloud and software services are purchased, the associated emissions typically sit within scope 3 purchased goods and services, or within scope 2 where an organisation runs its own estate. The ISSB's climate disclosure standard, IFRS S2, has been endorsed for use in the UK, and listing rules for premium-listed issuers already pull climate reporting into the annual cycle. Public sector buying adds a further lever: major central government contracts above £5m require a carbon reduction plan under Procurement Policy Note 06/21. For firms exporting into the EU, or UK subsidiaries of EU groups, the reach extends further still.
None of these instruments names software explicitly. That is precisely why engineering leaders should expect the question to arrive informally first — in a customer assurance questionnaire, a tender clarification, an investor diligence pack — before it hardens into a formal requirement.
Where the accounting still leaks
Candour is warranted. Supplier-provided figures vary in methodology and boundary. Shared infrastructure is allocated by convention rather than by truth. Embodied carbon data for accelerators and networking equipment is thin. Measurement uncertainty is rarely stated, and a headline number presented without it invites a credibility problem later. There is also a real risk of carbon theatre: dashboards that report a plausible figure nobody acts upon.
The remedy is modesty plus rigour — publish the method, state the assumptions, track the trend rather than the absolute, and tie the number to a decision. A figure that changes no design choice is decoration.
A ledger needs an owner
The unresolved question in most UK organisations is not technical but structural. Who owns the carbon budget of code? Platform teams can instrument; sustainability teams can report; procurement can apply leverage through supplier terms; finance can fund the work. Without a named owner at engineering leadership level, the measurement will stall at the pilot stage, as it has at many firms already.
The direction of travel, however, is clear. Energy is becoming a design parameter for software in the same way that thermal envelopes and material choices became design parameters for hardware. Teams that build the ledger now will find the constraint familiar by the time it becomes mandatory — and will have the evidence to argue their case when a customer, a regulator or a board finally asks.